El Niño - La Niña Effects
Coastal Ski Resorts
El Niño - La Niña Effects
Coastal Ski Resorts
Figure 1 Vertical dot plot for Mount Washington ski resort for winter mean temperature, snowfall, and rainfall. The purple lines are the means and the green bars the 10th to 90th percentile intervals. One-way ANOVA determined that significant differences exist between the three means (El Niño, La Niña, and neutral) for all three climate variables: P <0.001.
The four coastal ski resorts, Mt. Washington, Whistler Blackcomb, Cypress, and Sasquatch were analyzed to see the effect of El Niño-La Niña events on three climate variables important to maintaining favorable ski runs: winter mean temperature, winter snowfall, and winter rainfall. The data for this analysis comes from ClimateBC for the year 1951 to 2025. Because all three of these variables have seen change over this period due to human-caused climate change, each observation was adjusted by subtracting the linear trend (Ycalculated) from the recorded value (Residual = Ycalculated - Yobserved). If Ycalculated = Yobserved, the residual value would equal zero.
Figure 1 shows vertical dot plots for Mount Washington ski resort for winter mean temperature, snowfall, and rainfall. Data has been sorted according to whether the observation occurred during either an El Niño and La Niña event, or neutral conditions. The purple lines are the means and the green bars the 10th to 90th percentile intervals. Winter mean temperatures were on average for El Niño years 1.24 and 1.39°C warmer than the averages for neutral and La Niña events, respectively. El Niño winter snowfalls were on average 85 and 100 mm less than the averages for neutral and La Niña events, respectively. Winter rainfalls were on average for El Niño years 219 and 261 mm greater than the averages for neutral and La Niña events, respectively.
Figure 2 shows vertical dot plots for Cypress ski resort for winter mean temperature, snowfall, and rainfall. Winter mean temperatures were on average for El Niño years 1.48 and 1.40°C warmer than the averages for neutral and La Niña events, respectively. El Niño winter snowfalls were on average 129 and 141 mm less than the averages for neutral and La Niña events, respectively. Winter rainfalls were on average for El Niño years 177 and 142 mm greater than the averages for neutral and La Niña events, respectively.
Figure 3 shows vertical dot plots for Whistler Blackcomb ski resort for winter mean temperature, snowfall, and rainfall. Winter mean temperatures were on average for El Niño years 1.55 and 1.45°C warmer than the averages for neutral and La Niña events, respectively. El Niño winter snowfalls were on average 72 and 71 mm less than the averages for neutral and La Niña events, respectively. Winter rainfalls were on average for El Niño years 177 and 142 mm greater than the averages for neutral and La Niña events, respectively.
Figure 4 shows vertical dot plots for Sasquatch ski resort for winter mean temperature, snowfall, and rainfall. Winter mean temperatures were on average for El Niño years 1.71 and 1.50°C warmer than the averages for neutral and La Niña events, respectively. El Niño winter snowfalls were on average 286 and 308 mm less than the averages for neutral and La Niña events, respectively. Winter rainfalls were on average for El Niño years 196 and 206 mm greater than the averages for neutral and La Niña events, respectively.


Figure 2 Vertical dot plot for Cypress ski resort for winter mean temperature, snowfall, and rainfall. The purple lines are the means and the green bars the 10th to 90th percentile intervals. One-way ANOVA determined that significant differences exist between the three means (El Niño, La Niña, and neutral) for winter mean temperature and snowfall at P < 0.001. The significance of the winter rainfall was P = 0.014.

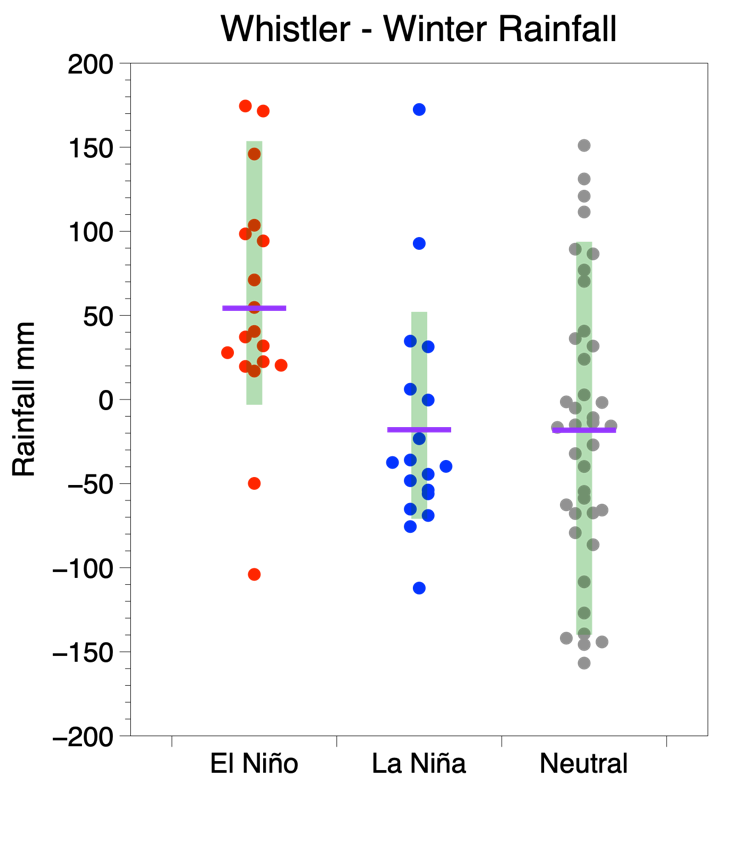
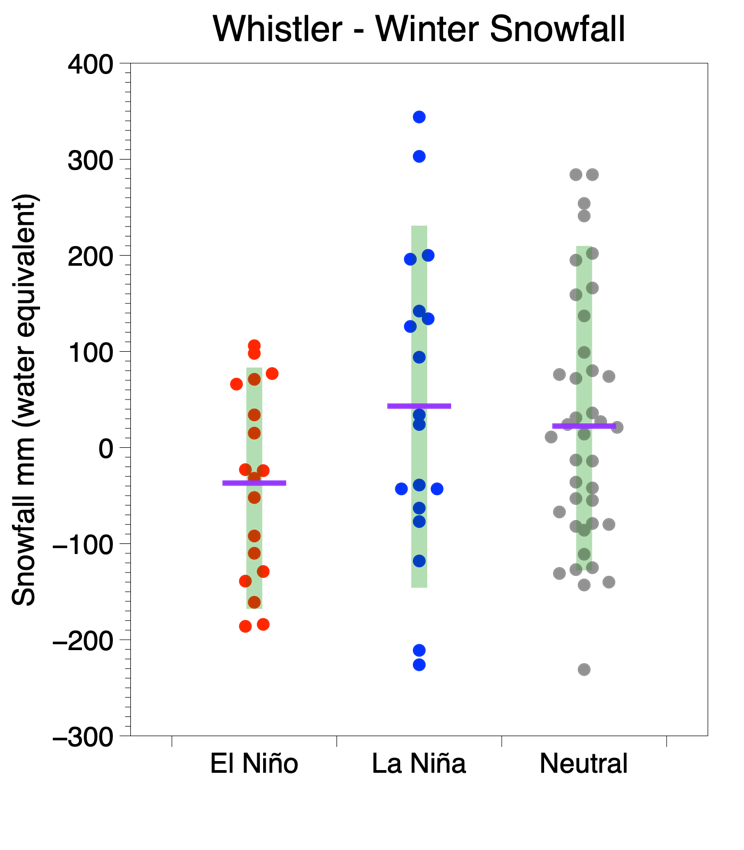
Figure 3 Vertical dot plot for Whistler Blackcomb ski resort for winter mean temperature, snowfall, and rainfall. The purple lines are the means and the green bars the 10th to 90th percentile intervals. One-way ANOVA determined that significant differences exist between the three means (El Niño, La Niña, and neutral) for winter mean temperature (P < 0.001) and rainfall at P = 0.004. Winter snowfall was considered not significant P = 0.165.


Figure 4 Vertical dot plot for Sasquatch ski resort for winter mean temperature, snowfall, and rainfall. The purple lines are the means and the green bars the 10th to 90th percentile intervals. One-way ANOVA determined that significant differences exist between the three means (El Niño, La Niña, and neutral) for winter mean temperature and snowfall at P < 0.001. Winter rainfall was considered not significant P = 0.085.
Copyright © 2026 Michael Pidwirny